Emissions in Asia
Show
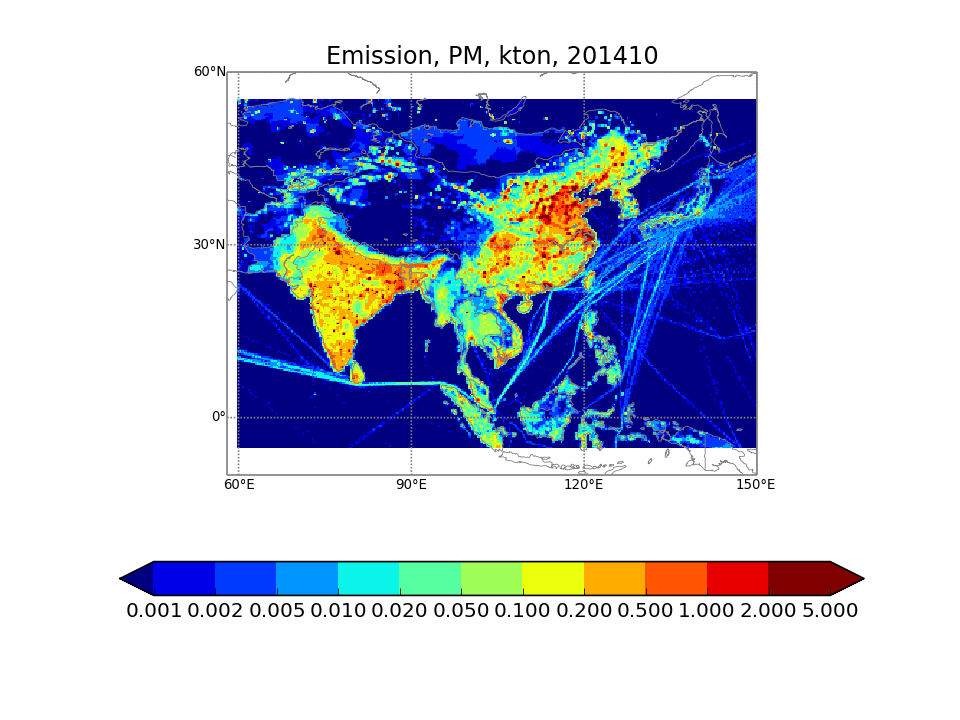
The emissions for 2014 are given in 0.25 degree grid. All other years are given in 0.5 degree grid.
Download
Description
Monthly PM2.5 anthropogenic emission estimates derived from the MODIS satellite observations and the MACCity inventory
using a 4D-Var based emission refinement algorithm described in Vira and Sofiev (2012).
References
- Vira, J., Sofiev, M., 2012. On variational data assimilation for estimating the model initial
conditions and emission fluxes for short-term forecasting of SOx concentrations. Atmospheric Environment 46, 318-328.
|


